Item analysis
Mastery-based learning puts pressure on educators to act on data fast, but the tools they had weren't built for speed or clarity. I redesigned the item analysis report to help teachers, assessment teams, and district admins quickly identify struggling students and problematic test questions.
Company: Schoology
Role: Senior Product Designer
Partners: Product management, Engineering, Customer success


Problem
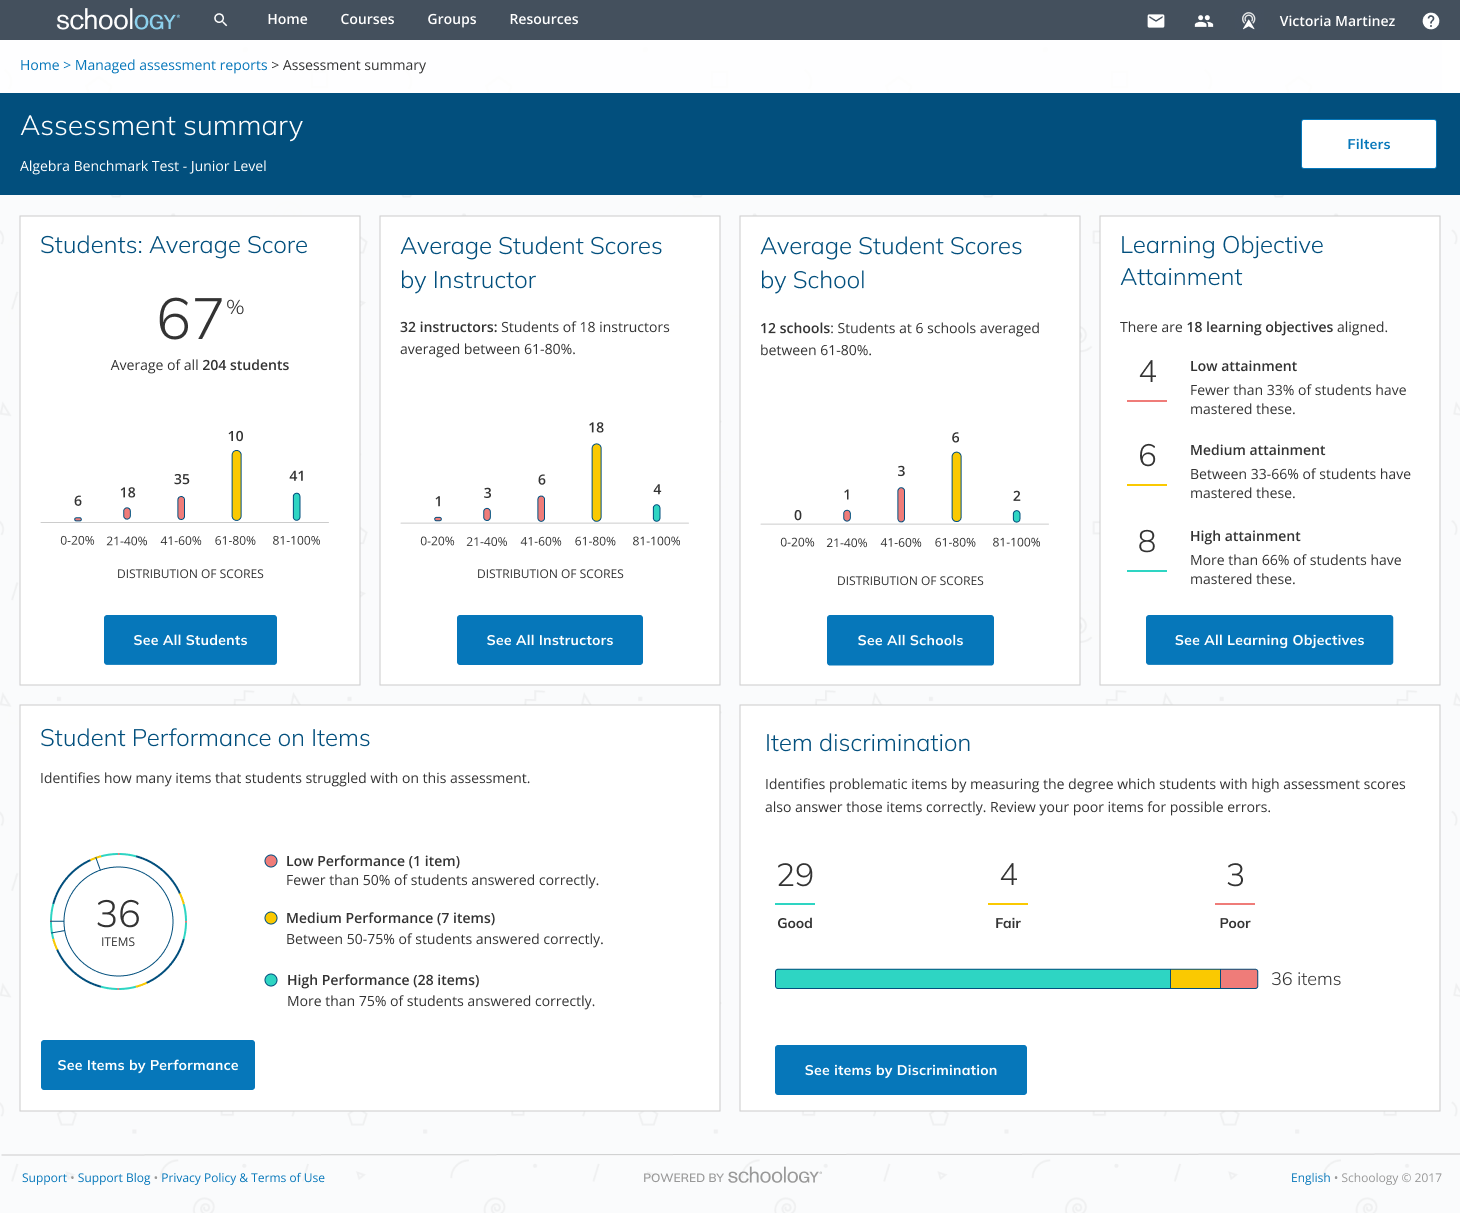
Existing item analysis tools were essentially spreadsheets of dense tables with no clear path to action. Three issues made this worse:
- Jargon barrier: "Item difficulty" and "item discrimination" are terms most classroom teachers don't know
- No demographic filtering: Educators couldn't slice data by student groups like Special Education or PHLOTE (Primary Home Language Other Than English); this masked which populations were falling behind
- Lack of guidance: even users who understood the data didn't know what action to take
Goals
Design a report that any educator (regardless of role or data literacy) could open and immediately understand. Every design decision had to be accessible and actionable.

Expected outcomes
Educators would re-teach missed concepts, rewrite flawed questions, surface resources for struggling students, and assign enrichment to excelling ones.
Process
Schema
Given the complexity of user roles and data relationships, I mapped every state and permission tier before touching UI. Early flows came from rough mobile thumbnails — quick to throw away, fast to iterate.
Wireframe testing
Feedback was strong from the start. The moment that stood out: when participants reached the item details page, which showed per-question metrics, student response breakdowns, distractor rationale, the reaction was immediate.
Redefining the jargon
My PM and I rewrote the definitions for item difficulty and item discrimination to be plain-language and action-oriented. Educators knew not just what the number meant, but what to do next.

“THIS is HOT. This is what I wanted. This is why we’re going to buy.”

